
Core debugging functionality
AlterNET Studio offers a robust set of script debugging engines for popular languages like C#, Visual Basic, TypeScript, JavaScript, and IronPython.
The script debugger, a non-visual component, provides essential debugging features through the IScriptDebuggerBase interface. This includes commands like Start, Stop, Break, Step Into, Step Over, and the ability to manage breakpoints. It also triggers events during debugging, such as when execution pauses, the debugger state changes, or the stack frame switches.
Underlying technologies
Our script debugging engines utilize different technologies:
- C#/Visual Basic: .NET Framework debugging API
- TypeScript/JavaScript: Google Chrome Debugger development tools
- Python/IronPython: Microsoft Script Hosting
Debugger User Controls
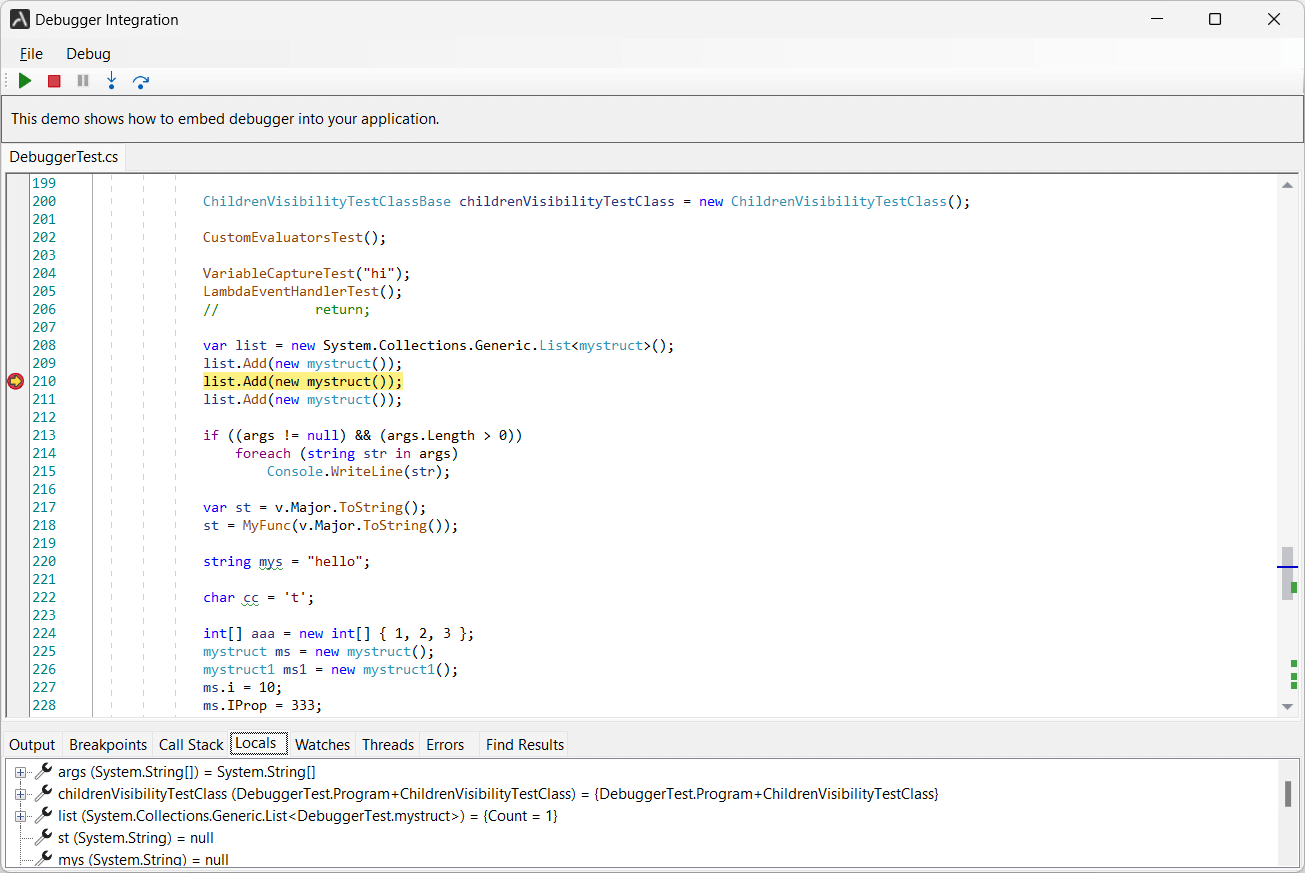
In addition to the Script Debugger itself, we provide a set of debugger user controls for both WinForms and WPF platforms, including Breakpoint, Stack Frame, Output, Locals, Watches, and Threads, as well as Debugger Toolbar and Menus.
Simplified Quick-Start project
These components are used in our AlterNET Studio demo project; however, that demo source code also includes lots of code related to file/project management, form designing, etc., which may create difficulty in understanding how it all works.
To streamline understanding, we’ve created a simplified quick-start project demonstrating how debugging logic is integrated. This project focuses on the essential components:
DebuggerPanelsTabControl - Houses all Debugger user controls such as Output, Breakpoints, Locals, Watches, and Stack Frames
DebugCodeEditContainer/DebuggerUIController - Manages the display of relevant script code during debugging, ensuring the correct code editor page is focused when execution pauses. containing Code Editor, which displays script text or opens a new page if the script file was not opened yet)
DebugMenu/DebuggerControlToolbar - Provides debug-specific menus and toolbars with commands like Start, Stop, Break, Step Into, and Step Over.
All the above elements are linked to the ScriptDebugger, and all glue logic is within these individual components, so there’s little code required to work script debugger application together:
var debugger = new ScriptDebugger
{
 ScriptRun = scriptRun1
};

codeEditContainer = new DebugCodeEditContainer(editorsTabControl);
codeEditContainer.EditorRequested += EditorContainer_EditorRequested;

debuggerControlToolbar1.Debugger = debugger;
debuggerControlToolbar1.DebuggerPreStartup += OnDebuggerPreStartup;

debugMenu1.Debugger = debugger;
debugMenu1.DebuggerPreStartup += OnDebuggerPreStartup;

debuggerPanelsTabControl.Debugger = debugger;

var controller = new DebuggerUIController(this, codeEditContainer);
controller.Debugger = debugger;
controller.DebuggerPanels = debuggerPanelsTabControl;
codeEditContainer.Debugger = debugger;
This approach simplifies integration and customization, making it easier to incorporate the script debugger into your own applications.
QuickStart projects showing how to integrate script debugging logic are available for WinForms, WPF, IronPython, Python, and TypeScript.